Imaging Spectrometers Information
Determining a material’s composition visually requires specialized equipment called an imaging spectrometer. An imaging spectrometer is an instrument that captures the spectrum of light reflected or emitted by an object or scene. The spectral information from each pixel of the image is used to determine information about the materials present in the scene. Because different materials absorb, reflect, and emit light differently in different spectrums, imaging spectrometers allow for the analysis of the chemical and physical properties of the materials being analyzed.
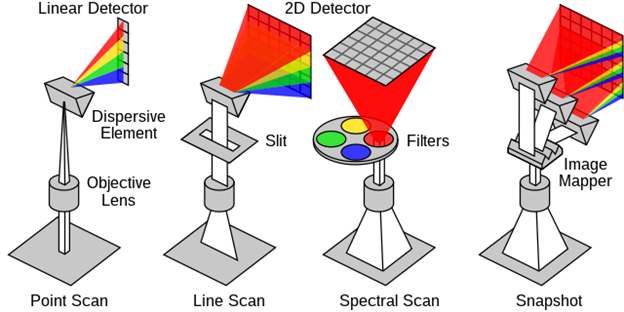
Figure 1: Comparison of four multispectral camera setups. Source: Lucasbosch/CC BY-SA 4.0
Imaging spectrometers typically consist of a telescope or other optical system to collect the incoming light, a spectrograph to disperse the light into its component wavelengths, and a detector to measure the intensity of the light at each wavelength. The resulting data is often referred to as a "hyperspectral image" because it contains much more spectral information than a typical image captured by a digital camera.
Determining the material composition of unknown substances is a critical function of imaging spectrometers. Common applications for imaging spectrometers include mineral exploration, crop monitoring, environmental assessment, and military surveillance. They are often mounted on aircraft or satellite platforms to enable remote sensing of the Earth's surface.
Theory of Application
Imaging spectrometers collect light reflected off of an object and then analyze the intensity of the wavelengths present at each pixel. Materials react differently to various wavelengths of light, sometimes absorbing, emitting, or reflecting certain wavelengths. Imaging spectrometers analyze the intensity of the light at different wavelengths across the electromagnetic spectrum.
Imaging spectrometers typically consist of a telescope or other optical system to collect the incoming light, a spectrograph to disperse the light into its component wavelengths, and a detector to measure the intensity of the light at each wavelength. The collected light is focused onto the entrance slit of the spectrograph, where it is separated into its component wavelengths by a diffraction grating or prism. The dispersed light is then focused onto the detector, which measures the intensity of the light at each wavelength.
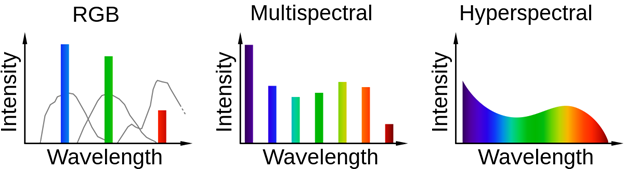
Figure 2: Comparison of spectral sampling in RGB, multispectral and hyperspectral imaging. Source: Lucasbosch/CC BY-SA 4.0
The resulting data is typically stored as a three-dimensional array, with the x and y dimensions representing the spatial dimensions of the image and the z dimension representing the wavelength. This data is used to create a hyperspectral image, which can be analyzed to identify and map the presence of different materials in the scene.
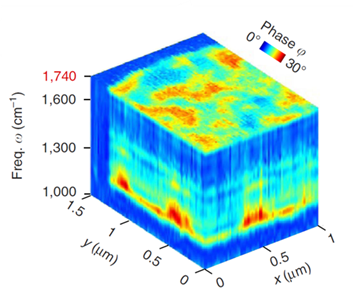
Figure 3: Hyperspectral data cube. Source: Iban Amenbar/CC BY 4.0
Specifications
Key specifications that pertain to imaging spectrometers include:
Spectral Range
This refers to the range of wavelengths that the spectrometer is able to detect. Most imaging spectrometers operate in the visible and near-infrared range of the electromagnetic spectrum, but some may also cover the shortwave infrared or middle infrared range.
Spectral Resolution
The width of the spectral bands that the spectrometer is able to detect is referred to as spectral resolution. A spectrometer with high spectral resolution is able to distinguish between closely spaced wavelengths, while one with low spectral resolution is only able to distinguish between broader ranges of wavelengths.
Spatial Resolution
This characteristic refers to the size of the smallest distinguishable feature that the spectrometer is able to detect in an image. It is typically expressed in pixels or micrometers.
Signal-to-noise Ratio
This refers to the ratio of the intensity of the signal being measured to the intensity of the noise present in the measurement. A spectrometer with a high signal-to-noise ratio is able to make more accurate measurements in the presence of noise.
Field of View
This parameter refers to the angular extent of the scene that the spectrometer is able to capture in a single image. It is typically expressed in degrees.
Swath Width
The width of the area that the spectrometer is able to image in a single pass is referred to as swath width. It is typically expressed in meters or kilometers for imaging equipment mounted to aircraft or satellites.
Data Acquisition Rate
This refers to the speed at which the spectrometer is able to collect and process data. It is typically expressed in pixels per second.
Types
There are several different types of imaging spectrometers, which can be broadly classified based on the type of spectrograph they use to disperse the light:
Grating Spectrometers
These spectrometers use a diffraction grating to disperse the light into its component wavelengths. Grating spectrometers are typically more compact and less expensive than other types of spectrometers, but they may have lower spectral resolution and a smaller spectral range.
Prism Spectrometers
Via a prism, these spectrometers disperse the light into its component wavelengths. Prism spectrometers are typically more expensive than grating spectrometers, but they may have higher spectral resolution and a wider spectral range.
Whisk Broom Spectrometer
With a mirror, these spectrometers direct light onto a single sensor. The mirror moves back and forth, collecting images from one pixel at a time. These spectrometers are more likely to wear out over time due to all of the movement required.
Push Broom Spectrometers
Similar to whisk broom spectrometers, push broom spectrometers use a line of sensors to collect an image one line at a time. Attached to an aircraft, these spectrometers image the entirety of the surface they fly over. These detectors must be carefully calibrated to ensure that the sensors all image wavelengths in the same way.
Tunable Filter Spectrometers
These spectrometers use a tunable filter to selectively pass light at a specific wavelength. Tunable filter spectrometers are typically more expensive and have a lower data acquisition rate than other types of spectrometers, but they may have higher spectral resolution and the ability to rapidly switch between wavelengths.
Fourier Transform Spectrometers
These spectrometers use an interferometer to measure the spectrum of light being imaged. Fourier transform spectrometers are typically more expensive and have a lower data acquisition rate than other types of spectrometers, but they may have very high spectral resolution and a wide spectral range.
Features
There are several important features to consider, in addition to the specifications discussed earlier, when evaluating imaging spectrometers:
Operating Wavelength
The operating wavelength of the spectrometer should be suitable for the application, taking into account the wavelengths of the materials to be detected and the atmospheric conditions. If certain compounds or materials are to be detected, the spectrometer should be calibrated and designed to image the relevant wavelengths for those materials.
Operating Environment
The spectrometer should be suitable for the operating environment, including factors such as temperature, humidity, and vibration. Without careful consideration of the operating environment, imaging spectrometers can quickly lose calibration or fail if used improperly.
Size and Weight
The size and weight of the spectrometer may be important for certain applications, such as those requiring a compact or portable instrument.
Construction
Imaging spectrometers are typically constructed using a combination of optical, mechanical, and electronic components. The specific design of an imaging spectrometer will depend on the type of spectrograph it uses to disperse the light and the desired performance characteristics.
Generally, an imaging spectrometer consists of the following components:
- Telescope or other optical system: This component collects the incoming light and focuses it onto the entrance slit of the spectrograph.
- Spectrograph: This component disperses the light into its component wavelengths. The spectrograph may use a diffraction grating, prism, or tunable filter to achieve this.
- Detector: This component measures the intensity of the light at each wavelength. The detector may be a charge-coupled device (CCD) or complementary metal-oxide-semiconductor (CMOS) array, among other types.
- Data acquisition and processing system: This component collects and processes the data from the detector and stores it in a form that can be analyzed.
In addition to these components, imaging spectrometers may also include a cooling system to reduce the noise of the detector, a calibration system to ensure the accuracy of the measurements, and a pointing and stabilization system to ensure that the instrument is pointed accurately and remains stable during data collection.
Applications
Imaging spectrometers have a wide range of applications, including:
Mineral Exploration
Imaging spectrometers are used to detect and map the presence of different minerals in the Earth's surface, which can help geologists identify potential ore deposits and evaluate the quality of these deposits.
Crop Monitoring
The health and growth of crops can be monitored with imaging spectrometers, as well as to detect pests and diseases. This information can be used to optimize irrigation and fertilization practices and to improve crop yields.
Environmental Assessment
Imaging spectrometers are used to monitor the health of forests, wetlands, and other natural habitats, as well as to assess the impact of human activities on the environment.

Figure 4: Illustration of spectrometer detecting leaks of trace gases such as methane. Source: Public domain
Military Surveillance
Military forces use imaging spectrometers to detect and identify objects and materials of interest, such as weapons and explosives.
Planetary Exploration
Imaging spectrometers are used on spacecraft to study the surface and atmosphere of other planets and moons in our solar system.
Medical Imaging
Analyzing the chemical and physical properties of tissues and other biological materials in medical imaging occurs with the help of imaging spectrometers.
Industrial Inspection
Imaging spectrometers are used in industrial applications to inspect and analyze the quality of materials and products. Imaging spectrometers can also be used to confirm chemical compositions are within desired ranges.
There are many other potential applications for imaging spectrometers, as they can provide detailed information about the chemical and physical properties of materials in a wide range of settings.
Standards
There are several standards that apply to imaging spectrometers, including:
ISO 12041
Specifies the requirements for the accuracy and performance of imaging spectrometers. It includes requirements for spectral range, spectral resolution, spatial resolution, signal-to-noise ratio, and other performance characteristics.
ISO 11123-2
Specifies the requirements for the measurement of the spectral reflectance of materials. It includes requirements for spectral range, spectral resolution, and other performance characteristics.
ISO 11146
Specifies the requirements for the measurement of the spectral transmittance of materials. It includes requirements for spectral range, spectral resolution, and other performance characteristics.
ISO 11664
This standard specifies the requirements for the measurement of the color of materials. It includes requirements for spectral range, spectral resolution, and other performance characteristics.
ISO/IEC 17025
This standard specifies the general requirements for the competence of testing and calibration laboratories. It includes requirements for the management and operation of the laboratory, as well as the technical competence of the personnel and the validity and traceability of the measurements.
There may be other standards that apply to specific applications or types of imaging spectrometers. It is important to consult the relevant standards and guidelines for your specific application.
Related Information
References
Suppliers by Country
Suppliers by State


