Real-Time Dashboards and Time-Period Perspectives
Featured Product from iba America LLC
Version 3.2 of ibaDaVIS delivers a major update that not only expands existing features but also unlocks entirely new application possibilities.
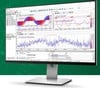
One of the key innovations is direct access to Time Periods from within ibaDaVIS. This allows users to define HD archives of Time Periods as data sources for table tiles. With just a few clicks, the corresponding data can be visualized, exported as a CSV file, or downloaded as an HDQ file for further analysis. Additionally, data from time-based HD storage can now be displayed in line charts. A particularly useful feature is the link between table and line chart: when a Time Period is selected in the table, the line chart automatically displays the corresponding signal trends for that exact time range.
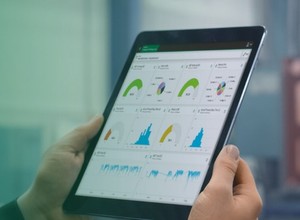
Another powerful addition is the ability to automatically update dashboards every second, enabling real-time visualization of HD data. This makes ibaDaVIS a perfect fit for use in control rooms or on operator panels in production environments. The display becomes more dynamic and helps users detect anomalies or deviations more quickly.
More Powerful Visualization Features
Additional enhancements include the new dark mode, which provides a more comfortable viewing experience — especially in low-light environments. A newly introduced radar chart tile offers a clear and compact way to visualize the value trends of multiple signals simultaneously. Line chart colors can now react dynamically to changing conditions — for instance, when thresholds are exceeded or to distinguish between different material types. Tables can now be sorted by multiple columns at once, offering a more structured view of large data sets.
The update also expands the capabilities for creating virtual signals: these can now be composed from different types of data sources, such as DAT files and associated time-based data. The redesigned signal tree improves orientation and signal display by allowing, for example, HD signals to be grouped by modules or logical units. Text values in tables or charts can now be filtered and analyzed with greater precision. With these improvements, ibaDaVIS opens up new possibilities for efficient data analysis in industrial environments.
The new version is available now for download.
ibaDaVIS
ibaDaVIS allows the visualization and analysis of your process and quality data as well as characteristic values in the web browser. You can interactively access detailed data from the overview on the dashboard.
Learn More or Talk to an Expert