Making Common Sense Common Practice: Models for Manufacturing Excellence

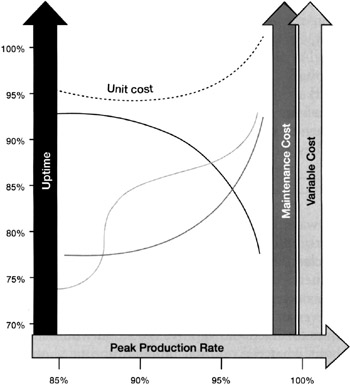
At Beta's Dwale plant, a continuous process plant, they had developed an understanding from a benchmarking effort that 95% uptime was a world-class level of performance for their type of plant. They determined their peak demonstrated sustainable production rate based on their output during their best-ever 3-day continuous performance. However, on further review, they found that there were non-linear variables for fixed and variable costs that would influence their decision about what the optimal targeted uptime should be. They found that variable costs in the form of energy and certain feed material increased sharply above about 87%, leveling off thereafter, but then increasing again above 95% (see Figure 1-7). They also found that maintenance costs increased sharply between about 90% and 95% of peak demonstrated rate, primarily due to fouling and choking of the process. This fouling also affected their ability to keep the process on line, reducing their uptime due to additional maintenance. After some analysis, they concluded that their best sustainable performance would be running the plant between 90 and 95% of peak demonstrated rate. Operating the plant at this rate, they felt they could achieve an uptime of 90%, which was considered to be their best achievable and sustainable production rate. It was just not realistic, nor cost effective, to try to run the plant at 100% of its demonstrated rate and still expect to achieve an uptime in the range of 95% without significant additional engineering and capital investment.