Writing Windows WDM Device Drivers

A nuts-and-bolts reference highlighting the Windows Driver Model (WDM).
This chapter looks at a fully-fledged driver, DebugPrint. The DebugPrint software lets you use formatted print trace statements in your code and view the output in the DebugPrint Monitor Win32 program.
Along the way, I cover the following important device driver topics.
System threads
Dispatcher objects: events, Mutexes, and semaphores
Linked lists
File I/O in drivers
Queuing IRPs
Basic cancel routines
Win32 overlapped I/O requests
The main design requirement for the DebugPrint software is that test drivers can do formatted prints that appear in a user mode application running on the same PC as the driver. The software must work under Windows 98 and Windows 2000. It should be easy for developers to include trace statements in their code. They should be able to use trace statements in most types of driver code.
This specification does not include source level debugging or breakpoints.
Figure 14.1 shows the design used in the DebugPrint software. The figure shows that more than one test driver can run at the same time. In each test driver, the trace output is first stored internally in an EventList doubly-linked list. A DebugPrint system thread in the driver code reads the EventList and writes the events to the DebugPrint driver.
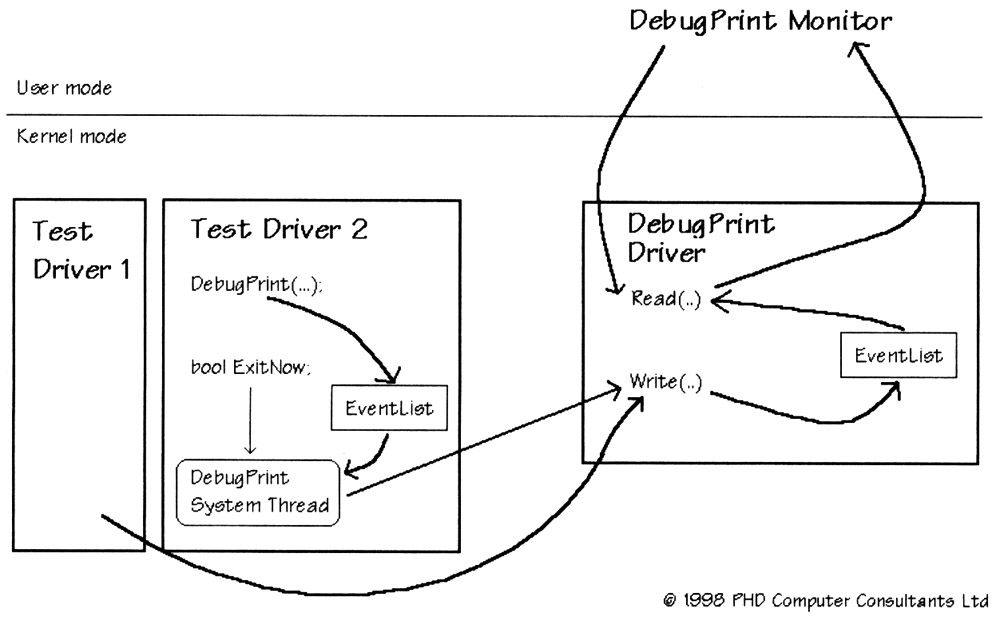
The DebugPrint driver write routine stores the trace events in its own EventList. The DebugPrint Monitor application issues read requests to the DebugPrint driver to...