Quantitative Finance And Risk Management: A Physicist's Approach

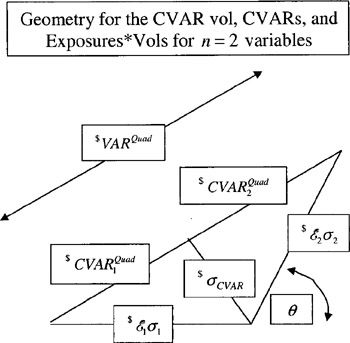
Here, we restrict our attention to two variables. We begin with the CVAR volatility. Here is a picture of the geometry:

The CVAR volatility [1] turns out to be the same for both variables. Both triangles with $ CVAR 1 Quad, $ CVAR 2 Quad have a common leg, the CVAR volatility $ ? CVAR. Writing the correlation ? 12 = cos ?, the CVAR volatility is

[1] Synopsis: For those of you who just tuned in, CVAR volatility measures the uncertainty in the contribution of risk of the corresponding variable to the total VAR. The superscripts "Quad" indicate quadratic forms appropriate in the case of linear risk. For notational simplicity, dt = 1 here. See preceding VAR chapters for details.
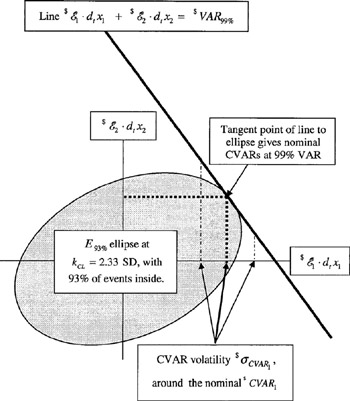
The following diagram gives the idea for the geometry. The details are below:

The axes are for the two individual risks
and
. For illustration, we used a 99% CL.
The line
is made up of points that, in a MC simulation, produce the value of the VAR at the 99% CL. This line defines a region to the left of the line containing 99% of probability, i.e. 99% of the MC events. To see this, recall that the integrated probability depending on the P&L variable F to be less than some given value F CL is