Effective Maintenance Management: Risk and Reliability Strategies for Optimizing Performance

3.10: Deterministic And Probabilistic Distributions

3.10 Deterministic And Probabilistic Distributions

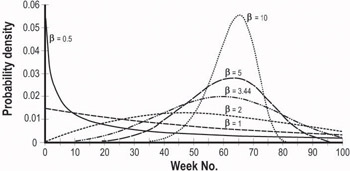
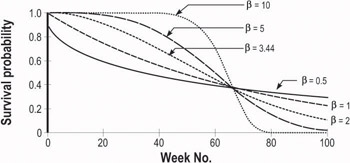
Information about the distribution of time to failures helps us to predict failures. The value of the Weibull shape parameter b can help determine the sharpness of the curve. When b is 3.44, the pdf curve approaches the normal or gaussian distribution.High b values, typically over 5, indicate a peaky shape with a narrow spread. At very high values of b, the curve is almost a vertical line, and therefore very deterministic. In these cases, we can be fairly certain that the failure will occur at or close to the h value. Figure 3.16 below shows a set of pdf curves with the same h value of 66.7 weeks we used earlier, and different b values. Figure 3.17 shows the corresponding survival probability or reliability curves. From the latter, we can see that when b is 5, till the 26th week, the reliability is 99%.


Figure 3.16: Probability density functions for varying beta values

Figure 3.17: Survival probability for varying beta values

On the other hand, when we can be fairly sure about the time of failure, that is, with high Weibull b values, time-based strategies can be effective. If the failure distribution is exponential, it is difficult to predict the failures using this information alone, and we need additional clues. If the failures are evident and we can monitor them by...

UNLIMITED FREE
ACCESS
TO THE WORLD'S BEST IDEAS

SUBMIT
Already a GlobalSpec user? Log in.

This is embarrasing...

An error occurred while processing the form. Please try again in a few minutes.

Customize Your GlobalSpec Experience

Category: Color Meters and Appearance Instruments
Finish!
Privacy Policy

This is embarrasing...

An error occurred while processing the form. Please try again in a few minutes.