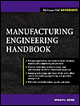
Manufacturing Engineering Handbook

Roderick A. Munro
RAM Q Universe, Inc.
Reno, Nevada
SPC can be defined as the use of statistical techniques to depict, in real time, how a process is performing through the use of graphical tools. Many engineers have heard about the Shewhart control charts, now being called process behavior charts, which were first developed in the late 1920s. However, there are many other tools available that we will briefly review in this chapter with references to where more information can be found if needed. It is recommended that the manufacturing engineer use this as an overview of the topic of statistical process control (SPC), which should not be confused with statistical process display (SPD). Many organizations get into the habit of posting graphs around the organization without the benefits of using what the graphs are intended to tell the operator and supervisors. Thus SPC is a real time graphical tool process that gives insight into the process behavior that is being studied.
The tools are listed alphabetically to allow for ease of finding the reference quickly. This should in no way be taken to indicate a sequence or importance of use. All of these tools are useful for their intended usage and the manufacturing engineer is encouraged to become aware of as many of these as possible. This will prevent the old adage of everything starting to look like a nail if you only have a hammer in your toolbox.
Tip. In this section, you will note a...