Smoke, Dust, and Haze: Fundamentals of Aerosol Dynamics, Second Edition

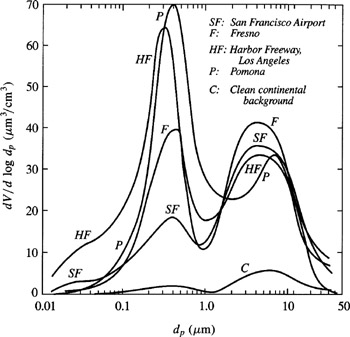
The size distribution of the atmospheric aerosol results from the action of the dynamic processes discussed in this book, on particles and gases introduced into the atmosphere from natural and man-made sources. Measurements of atmospheric size distributions at various California locations are shown in Fig. 13.1 as dV/ d log d p versus log d p. Plotted in this form, the aerosol mass in any size range is proportional to the area under the curve between the size range limits, assuming that particle density does not vary with particle size. Figure 13.1 shows that there are usually two modes in the mass distribution: the coarse mode corresponding to particles larger than 2 to 3 ?m in diameter and the accumulation mode between about 0.1 and 2.5 ?m. Distributions of this form have been observed at many different geographical locations. This important generalization, due to K. T. Whitby, has had a profound effect on our understanding of the atmospheric aerosol. Particles smaller than about 0.1 ?m, the ultrafine range, sometimes appear in the form of an additional mode if freshly formed or emitted. Usually, however, the ultrafine mass distribution decreases monotonically with decreasing particle size. Aerosol number and volume concentrations in each size range can be grouped according to the type of atmospheric region. Approximate values for these integral parameters are given in Table 13.1.