Valuation Methods and Shareholder Value Creation
Chapter 6: Dividends and Market Value

6.1. EVOLUTION OF DIVIDENDS ON THE U.S. STOCK MARKET

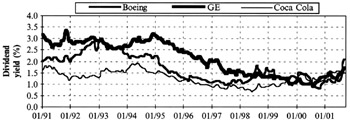
Figure 6.1 shows the evolution of the dividend yield [1] of three of the largest North American companies: GE, Boeing, and Coca-Cola.


Figure 6.1: Evolution of the dividend yield of GE, Boeing, and Coca-Cola.

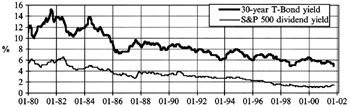
Figure 6.2 shows the evolution of the yield on 30-year Government bonds and the dividend yield in the United States. Both yields have fallen in the last 20 years. Although Figure 6.2 seems to show that the yield on Government bonds has always been greater than the stock market's dividend yield, Fisher and Statman (2000) show that the dividend yield was greater than the yield on Government bonds in every year from 1879 to 1958. The average difference during those years between the dividend yield and the yield on Government bonds was 1.87%.


Figure 6.2: Dividend yield and yield on 30-year Government bonds in the United States.

[1]The dividend yield is the dividend per share (DPS) divided by the share price (P).

6.2. INCREASINGLY FEWER COMPANIES DISTRIBUTE DIVIDENDS AND MORE BUY BACK SHARES

There are increasingly fewer companies that distribute dividends. In 1998, only 20.7% of the 5,655 companies listed on the main U.S. stock markets (NYSE, AMEX, and NASDAQ) paid dividends. As Table 6.1 shows, of the 4,484 companies that did not pay dividends in 1998, 3,981 companies had never paid dividends since they were incorporated, and 503 companies had paid dividends in previous years.

Table 6.1: Dividend Distribution by Companies Listed on the...

UNLIMITED FREE
ACCESS
TO THE WORLD'S BEST IDEAS

SUBMIT
Already a GlobalSpec user? Log in.

This is embarrasing...

An error occurred while processing the form. Please try again in a few minutes.

Customize Your GlobalSpec Experience

Category: Standards and Technical Documents
Finish!
Privacy Policy

This is embarrasing...

An error occurred while processing the form. Please try again in a few minutes.