Engineering Rock Mechanics: An Introduction to the Principles

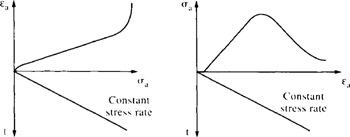
The effects of the two extreme options for loading, i.e. stress control and strain control, are illustrated in Fig. 6.5. Note that in this figure we have chosen the axes such that the independent variable is plotted along the x-axis. The first curve represents the application of an increasing load (for example, a series of weights) to the specimen. When the peak strength is reached, the deadweight causes a continous increase in strain at this peak stress level, i.e. the specimen is uncontrollably crushed. The second curve represents the continual compression of the specimen as the ends are moved together (for example, in a screw-controlled press); the stress associated with this movement can rise or fall without uncontrolled failure.
This situation can be considered as simply shortening the sample and measuring the associated load. The resultant curve, known as the strain-controlled complete stress-strain curve, was first obtained in 1966. A list of the developments in materials science testing leading up to this time is given in Hudson et al.(1972).
Because rock often has a higher stiffness than standard testing machines, even under strain control, the complete curve often cannot be obtained without modifying the machine. The testing techniques required for rock mechanics are thus unique, both in their requirements and their methodologies. For example, in soil mechanics testing, the soil usually has a low enough stiffness to allow the complete curve to be obtained as...