Quantitative Methods in Project Management

This book combines theoretical and practical applications and takes project managers through the most important quantitative methods, integrates them, and illustrates interrelationships.
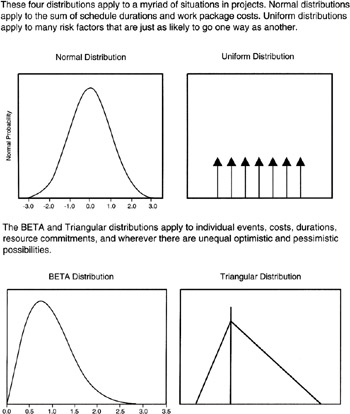
If we plot the probability (density) function (PDF) on a graph with vertical axis as probability and horizontal axis as value of X, then that plot is called a "distribution." The PDF is aptly named because the PDF shows the distribution of value according to the probability that that value will occur, as illustrated in Figure 2-3. [9] Although the exact numerical values may change from one plot to the next, the general patterns of various plots are recognizable and have well-defined attributes. To these patterns we give names: Normal distribution, BETA distribution, Triangular distribution, Uniform distribution, and many others. The attributes also have names, such as mean, variance, standard distribution, etc. These attributes are also known as statistics.

The discrete Uniform distribution is illustrated in Figure 2-4. The toss of the coin and the roll of the single die are discrete Uniform distributions. The principal attribute is that each value of the random variable has the same probability. In engineering, it is often useful to have a random number generator to simulate seemingly totally random events, each event being assigned a unique number. It is very much desired that the random numbers generated come from a discrete Uniform distribution so that no number, thus no event, is more likely than another.
If the random variable is continuous, or the values of the discrete random variable are so close together so as...