4.1. Input-Output Spectral Relationship
Figure 3 outlines the broad steps in the cumulant spectral analysis of a LTI system. The relationship of the nth-order ( n ? 2) cumulant spectra of the stationary input Q and output y is given as45 , 46:
| (46) | 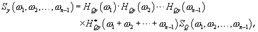
|
where H Qy( ?) is the linear transfer function:
| (47) | 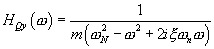
|
for the governing equation:
| (48) | 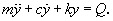
|
In modal analysis of a fixed platform, m, c and k are structural modal mass, damping and stiffness, respectively. Here, the first vibration mode is considered for its largest contribution to the platform response, with the natural frequency 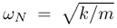 . Obviously S y( ? 1, ? 2, , ? n -1) depends on S Q( ? 1, ? 2, , ? n -1), where the latter is available through the ( n - 1)-dimensional Fourier transform of the nth-order cumulant functions of Q44:
| (49) | 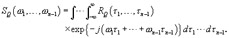
|
Similarly, if S y( ? 1, , ? n -1) is known, the nth-order cumulant functions of displacement can be estimated through the inverse Fourier transform:
| (50) | 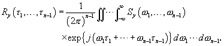
|
By choosing n = 2, 3 and 4, S( ? 1, , ? n -1) represents the power-spectrum, bi-spectrum and tri-spectrum respectively and R( ? 1, , ? n -1) represents the autocorrelation function, third- and fourth-order cumulant functions. Setting ?