Statistical Aspects of the Design and Analysis of Clinical Trials, Revised Edition
The analysis of a set of survival data from a clinical trial usually begins with a numerical or graphical summary of the survival times for individuals in the different treatment groups. Such summaries may be of interest in their own right, or as a precursor to a more detailed analysis of the data. Two functions describing the distribution of survival times which are of central importance in the analysis of survival data are the survivor function and the hazard function.
The survivor function, S(t) is defined as the probability that the survival time, T, is greater than or equal to t, i.e.,
If the random variable T has a probability density function f(t), then the survivor function is given by:
where F(t) is the cumulative distribution function of T.
Two probability distributions often used to introduce the analysis of survival data are the exponential distribution and the Weibull distribution. The probability density function of the former is:
and of the latter:
This is a Weibull distribution with scale parameter ? and slope parameter ?. (The exponential distribution is a special case of the Weibull distribution with ? = 1.)
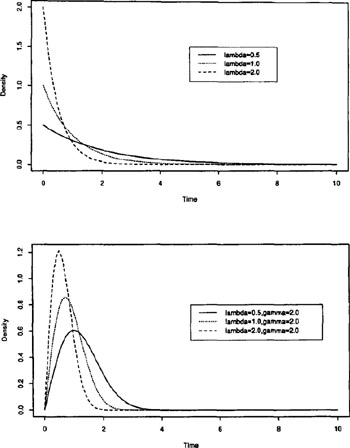
Examples of each density function for a variety of parameter values are shown in Fig. 8.1
The survivor function for the exponential distribution is:
and for the Weibull distribution
Graphs...