Cool Thermodynamics: The Engineering and Physics of Predictive, Diagnostic and Optimization Methods for Cooling Systems

"For every complex problem, there is a solution that is simple, neat and wrong."
- H.L. Mencken
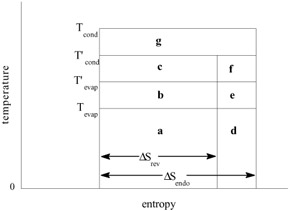
A thermodynamic diagram for a chiller cycle is usually plotted as pressure against volume, or temperature against entropy, for the refrigerant, because the areas under these curves are readily identifiable with heat flows and work. Particularly convenient and instructive is the T-S diagram for ideal chiller cycles, where all heat transfers are isothermal and all connecting branches ( e.g., compression and expansion) are isentropic (Figure 2.2). It is then easy to visualize each of the principal elements in the energy and entropy balance, not to mention the facility with which they can be calculated as the areas of simple rectangles.
A classic pedagogical example is the reversible cycle (subscript "rev"), drawn in Figure 13.1. Figure 13.1 is embellished to include another idealized instructive example: the endoreversible cycle (subscript "endo"), in which the external irreversibilities of finite-rate heat transfer are incorporated (but internal dissipation is neglected). T' and T denote reservoir and refrigerant temperatures, respectively.
Figure 13.1 is drawn such that the cooling...