Fundamentals of Digital Imaging

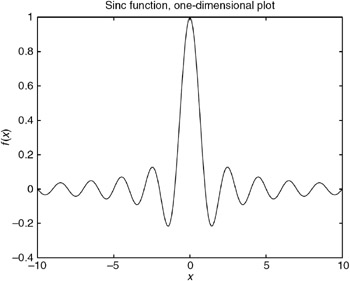
One difference between one-dimensional and two-dimensional functions is the way in which they are displayed. One-dimensional functions are easily displayed on a graph where the scaling is obvious. One dimension, usually the horizontal, is used to represent the abscissa or independent axis; the second dimension of the display is used to represent the ordinate or dependent axis. The function, y = f ( x), is usually represented as ordered pairs, [ x, f ( x)]. The value of points along the axes are usually displayed adjacent to the axes as in Fig. 3.1. The observer need only examine the numbers that label the axes to determine the scale of the graph and get a mental picture of the function.
With two-dimensional scalar-valued functions, the display becomes more complicated, since there are more degrees of freedom in the function than are available on the two-dimensional display, i.e., two independent coordinate values and one dependent value. The two-dimensional function, z = f ( x, y), is represented by an ordered triple, [ x, y, f ( x, y)]. There are many ways of displaying such functions. The reader has probably seen several. There are advantages and disadvantages to all of them. The point here is not to summarize all the possibilities but to relate the characteristics of those representations to the display of images. The main emphasis will be on the scaling of the...