Introduction to Bioinformatics
This textbook is a solid introduction to the science of Bioinformatics, an integration of computing skills and biological methods.
 TABLE OF CONTENTS
 The dotplot is a simple picture that gives an overview of the similarities between two sequences. Less obvious is its close relationship to alignments.
The dotplot is a table or matrix. The rows correspond to the residues of one sequence and the columns to the residues of the other sequence. In its simplest form, the positions in the dotplot are left blank if the residues are different, and filled if they match. Stretches of similar residues show up as diagonals in the upper left-lower right (Northwest-Southeast) direction.
Dotplot showing identities between short name (DOROTHYHODGKIN) and full name (DOROTHYCROW-FOOTHODGKIN) of a famous protein crystallographer.
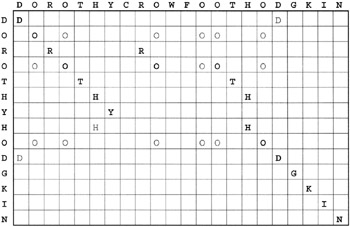
Letters corresponding to isolated matches are shown in non-bold type. The longest matching regions, shown in boldface, are the first and last names DOROTHY and HODGKIN. Shorter matching regions, such as the OTH of dorOTHy and crowfoOTHodgkin, or the RO of doROthy and cROwfoot, are noise.
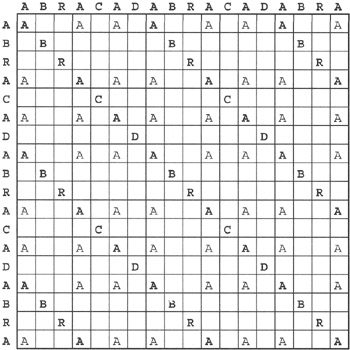
Dotplot showing identities between a repetitive sequence (ABRACADABRACADABRA) and itself. The repeats appear on several subsidiary diagonals parallel to the main diagonal.
Dotplot showing identities between the palindromic sequence MAX I STAY AWAY AT SIX AM and itself. [1] The palindrome reveals itself as a stretch of matches perpendicular to the main diagonal.
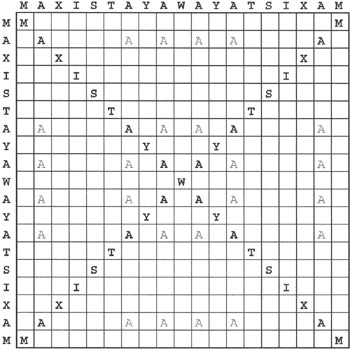
This is not just word play - regions in DNA recognized by transcriptional regulators or restriction enzymes have sequences related to palindromes, crossing from one strand to the other:
| EcoRI recognition site: | GAATTC |
| CTTAAG |
Within...