Introduction to Bioinformatics
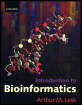
This textbook is a solid introduction to the science of Bioinformatics, an integration of computing skills and biological methods.
 TABLE OF CONTENTS
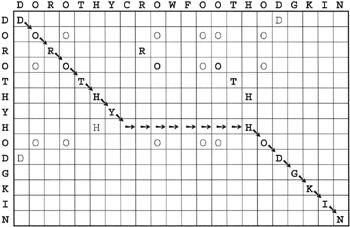
 The dotplot captures in a single picture not only the overall similarity of two sequences, but also the complete set and relative quality of different possible alignments. Any path through the dotplot from upper left to lower right, moving at each point only East, South or Southeast, corresponds to a possible alignment. If two sequences are closely related, the alignment can be read directly off the dotplot.
Figure 4.1 shows an example based on the Dorothy Hodgkin dotplot. If the direction of the 'move' between successive cells is diagonal, two pairs of successive residues appear in the alignment without an insertion between them. If the direction of the move is horizontal, a gap is introduced in the sequence indexing the rows. If the direction of the move is vertical, a gap is introduced in the sequence indexing the columns. Note that no moves can be directed up or to the left, as this would correspond to aligning several residues of one sequence with only one residue of the other. The path indicated by the arrows corresponds to the obvious alignment:
DOROTHY--------HODGKIN DOROTHYCROWFOOTHODGKIN