Modern Microwave Circuits

Including over 1,200 equations and more than 300 illustrations, this invaluable book explains how microstrip circuits are built and provides in-depth coverage of computer-aided simulation and underlying theories.
The Smith chart is a graphical tool that represents a mapping between impedance and reflection coefficient planes. It was introduced by Phil Smith of RCA in 1936. It is an extremely convenient tool because it maps the infinite Z in plane to a finite ? in plane. For this reason, it greatly simplifies the impedance matching problems. Once it is understood properly, one can easily determine the type of matching network and the amount of matching required to match a particular impedance by just inspecting the location of that impedance point on the Smith chart.
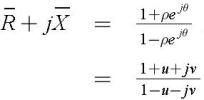
To show how the chart is constructed, we first write the relationship between input impedance and the reflection coefficient:
where Z 0 is the reference impedance. Then, the above equation can be put into the following form by separating the real and imaginary parts:
where u = ? cos and ? and v = ? sin ?. R and X are normalized resistance and reactance, respectively. By equating the real and imaginary parts, the following sets of equations can be obtained:
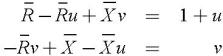
Then, by solving the above equations for R and X, one gets the following:
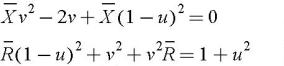
The above sets of equations can be placed into a more convenient form as follows:
which represents circles in the u and v planes (i.e., reflection coefficient plane) for constant reactance, X, and constant resistance, R, respectively. Figure 1.28...


