Suppose samples are taken on a fixed schedule a certain number of time units apart: every hour, for example, at the beginning of each shift, or at noon every day. For the ith sample, a property of interest (the critical content) is measured as a percent weight fraction [23] of the total sample weight. This content, c i, is recorded. After a fixed number n of samples is taken, we compute the average A of the contents c i. Now we are ready to compute each point in the variogram. The jth variogram point V ( j) is calculated as
This is the variation of all samples that are j time units apart. Division by A 2 makes it a relative variance. An example is given in Figure D.1 with code for the Excel macro given in Table D.1.
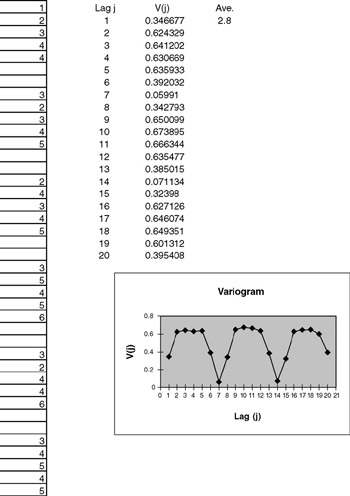 Figure D.1: Data and variogram for Figure 4.17. Blanks indicate missing values.
 Table D.1: Visual basic code for variogram. | ' Code developed and Copyrighted by Windward Technologies, Inc.' Licensed to Alpha Stat Consulting Company for individual use only.' Contact Alpha Stat Consulting Company for other licensing options.' Web:www.alphastat.com Email:alpha@alphastat.comOption ExplicitOption Base 1Dim xd As RangeDim yd As RangeDim y(4) As IntegerDim s As RangeSub Variogram()Dim x(4) As Integer, num As Integer, num2 As IntegerDim data() As Double, v() As Double, ave As Double, ave2 As Double, varsum As DoubleDim denom As DoubleDim i As Integer, j As Integer, special_const As... |
Copyright American Statistical Association and the Society for Industrial and Applied Math 2001 under license agreement with Books24x7