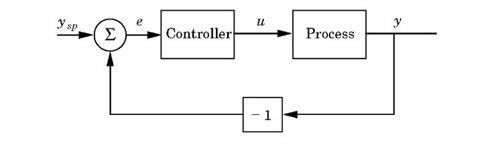
In 1988 we published the book Automatic Tuning of PID Controllers, which summarized experiences gained in the development of an automatic tuner for a PID controller. The present book may be regarded as a continuation of that book, although it has been significantly expanded. Since 1988 we have learned much more about PID control as a result of our involvement in research and industrial development of PID controllers. Because of this we strongly believe that the practice of PID can be improved considerably, and that this will contribute significantly to improved quality of manufacturing. This belief has been strongly reinforced by recent publications of the industrial state of the art, which are referenced in Chapter 1. The main reason for writing this book is to contribute to a better understanding of PID control. Another reason is that information about PID control is scattered in the control literature. The PID controller has not attracted much attention from the research community during the past decades, and it is often covered inadequately in standard textbooks in control. We believe that this book will be useful to users and manufacturers of PID controllers as well as educators, it is important to teach PID control in introductory courses on feedback control at universities, and we hope that this book can give useful background for such courses. It is assumed that the reader has a control background. A reader should be familiar with concepts such as transfer functions, poles, and zeros. Even so, the explanations are elementary. Occasionally, we have stated facts without supporting detailed arguments, when they have seemed unnecessary, in an effort to focus on the practical aspects rather than the theory. A reader who finds that he needs some specific background in process control is strongly advised to consult a text in process control such as Seborg et al. (1989). Compared to the earlier book we have expanded the material substantially. The chapters on modeling, PID control, and design of PID controllers have been more than doubled. The chapter on automatic tuning has been completely rewritten to account for the dynamic product development that has taken place in the last years. There are two new chapters. One describes new tuning methods. This material has not been published before. There is also a new chapter on control paradigms that describes how complex systems can be obtained by combining PID controllers with other components. We would like to express our gratitude to several persons who have provided support and inspiration. Our original interest in PID control was stimulated by Axel Westrenius and Mike Sommerville of Eurotherm who shared their experience of design and of PID controllers with us. We have also benefited from discussions with Manfred Morari of Caltech, Edgar Bristol of Foxboro, Ken Goff formerly of Leeds and Northrup, Terry Blevins of Fisher-Rosemount Control, Gregory McMillan of Monsanto. Particular thanks are due to Sune Larsson who initiated our first autotuner experiments and Lars Bååth with whom we shared the pleasures and perils of developing our first industrial auto-tuner. We are also grateful to many instrument engineers who participated in experiments and who generously shared their experiences with us. Among our research colleagues we have learned much from Professor C. C. Hang of Singapore National University with whom we have done joint research in the field over a long period of time. We are also grateful to Per Persson, who developed the dominant pole design method. Several persons have read the manuscript of the book. Willy Wojsznis of Fisher-Rosemount gave many valuable suggestions for improvements. Many present and former colleagues at our department have provided much help. Special thanks are due to Eva Dagnegård and Leif Andersson who made the layout for the final version and Britt-Marie Mårtensson who drew many of the figures. Ulf Holm-berge Karl-Erik Årzén and Mikael Johansson gave very useful input on several versions of the manuscript. Finally we would like to express our deep gratitude to the Swedish National Board of Industrial and Technical Development (NUTEK) who have supported our research.
Department of Automatic Control karl_johan.astrom@control.lth.se |