Applications of Reference Materials in Analytical Chemistry

By calibration model [1] is meant a mathematical description of the way the instrument signal varies with changing quantities ( e.g. mass, concentration) of the particular analyte being measured. A number of models are observed in practice, the most important ones of which are described below.
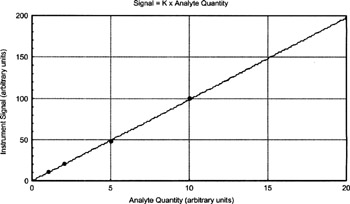
A commonly encountered model is where the instrument signal is a linear function of the quantity of analyte, which may be described by the equation:
K is a proportionality constant, the value of which does not need to be formally known or calculated, although it enters implicitly into the calculation of the analyte concentration in a sample when the instrument signal for the sample is compared with the instrument signal for the calibration standards. The value B represents the instrument signal obtained when a blank calibration standard is measured ( e.g. a solution identical to that used to prepare the calibration standards, but not containing the specific reference analyte of interest). Figure 4.2 shows a typical graph of a linear calibration model according to Eq. 4.5, for a value of B = O ( i.e. where the instrument response to the calibration blank [analyte quantity = O] is zero).
A model that is sometimes encountered is where the instrument gives a signal even when a calibration blank is measured. Figure 4.3 shows the graph for calibration model 2, where B