Applications of Reference Materials in Analytical Chemistry
4.8: Using Linear Regression to Calculate the Calibration Line

4.8 Using Linear Regression to Calculate the Calibration Line

The least squares method of linear regression [4] , [6] [8] is used to fit the best straight line to a set of calibration data such as that shown in Table 4.8. (Chapter 3, Section 3.11 describes the statistical principles underlying the method of linear regression).

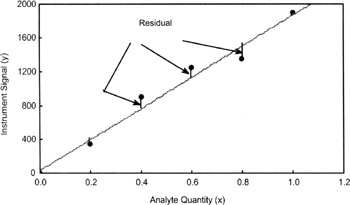
The best straight line is that which minimises the sum of the squares of the residual distances of the individual calibration points (measured on the y-axis, i.e. instrument signal axis) from the calculated best straight line. This is referred to as the regression of y on x and Figure 4.9 illustrates the residual distances of the calibration points from the calibration line.


Figure 4.9: Residuals of calibration points for the regression of y on x

The important parameters of the regression line are:

  • the slope of the line and its uncertainty

  • the intercept of the line and its uncertainty

These parameters are readily calculated using an appropriate software package and a personal computer. For background information, the formulae for the calculations of the uncertainty estimates (as standard deviations) of the slope and intercept of the line are given below. In Eqs. 4.9 and 4.10, s m is the standard deviation of the slope and s c is the standard deviation of the intercept respectively.


The parameter rsd is the residual standard deviation (also known as the residual standard error and the standard error of the estimate).

UNLIMITED FREE
ACCESS
TO THE WORLD'S BEST IDEAS

SUBMIT
Already a GlobalSpec user? Log in.

This is embarrasing...

An error occurred while processing the form. Please try again in a few minutes.

Customize Your GlobalSpec Experience

Category: Chart Recorders
Finish!
Privacy Policy

This is embarrasing...

An error occurred while processing the form. Please try again in a few minutes.