Developed from university courses, this text provides a thorough introduction to the acquisition, processing, and interpretation of 3-D seismic data, theory, techniques, and applications.
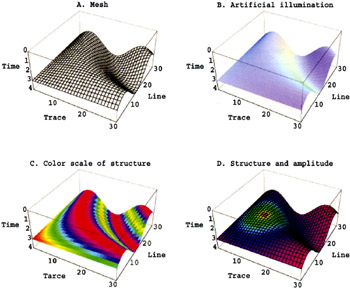
Plate 1: The horizon slice is a time structure surface generated by automatic event picking in the seismic data volume. Shown here are various perspective plots of time structure associated with a 3D horizon slice. (A) Simple time structure mesh. (B) Artificial illumination used to bring out subtle features in complex surfaces. (C) Color scale of time structure draped over the time structure surface. (D) Combined time structure (mesh) and horizon amplitude (color) display.
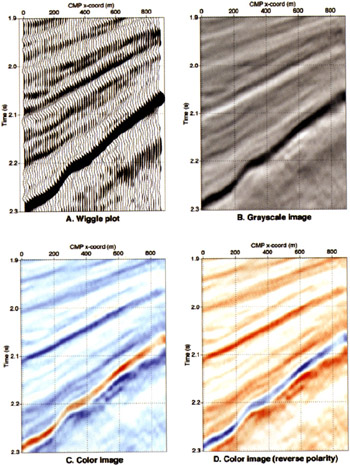
Plate 2: Display of seismic data composed of 60 traces and 101 lime samples, (A) Wiggle trace display with variable area, meaning that deflections to the right are filled in with black. (B) Grayscale image of the same data. (C) Color image with red representing positive amplitudes. (D) Reverse polarity color image. Blue now represents positive amplitudes.
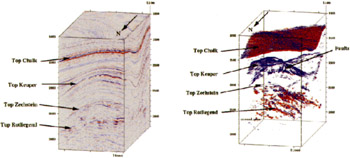
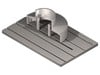
Plate 3: In volume visualization the data is mapped onto a 3D array of voxel graphic elements. Each voxel has a color representing seismic amplitude at that location and a variable transparency level. This allows creation of a semi-transparent data volume, in which certain amplitude ranges are opaque and all others are transparent. This example is from the southern North Sea Basin (From [62]).
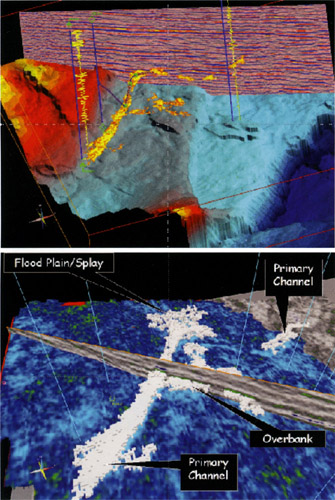
Plate 4: Immersive volume interpretation of 3D seismic data can include arbitrary 21) subsets, well tracks with log information and trajectory, rendered geologic surfaces, voxel tracking, and innumerable other features. These examples are from the Earthcube interpretation system (Courtesy Landmark Graphics, a Halliburton Company).
Plate 5: Part of a...
Copyright PennWell Corporation 2004 under license agreement with Books24x7