The Lean Assessment for Job Shops and Small Manufacturers, Plant Edition
This unique toolbook will provide your organization with a self-administering course of action that leads to necessary cost reductions required by customers.
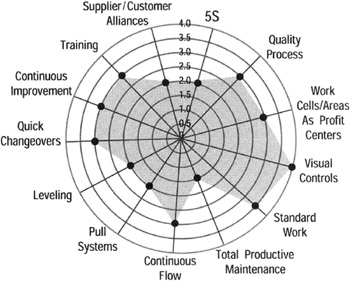
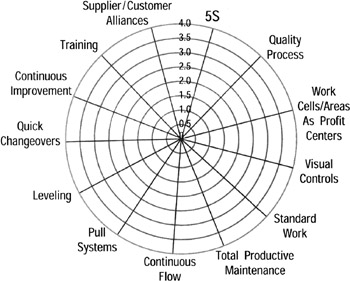
On the blank Lean Assessment Radar Chart on the next page plot the average points from the thirteen score sheets.
| Note | You might want to make additional copies for later use. Draw a line connecting the point values on the chart for a visual representation of your organization's overall Lean profile. |
Your radar chart will look something like the Sample Radar Chart below. See Figure 8 Sample Radar Chart. You can also plot a chart using your previous score for comparison. If you plot both charts on a transparency you can overlay one on the other for a better visual effect.
Company/Plant Name: _________________________________
Date: _______________________
Location: ____________________
Assessor(s): __________________
____________________________
____________________________
____________________________
Once you have completed all thirteen scoring sheets, you should have an average number of points allocated for each Lean building block. See Fig. 9 Average Points.

Transfer the Average Points Scores to the Summary Score Sheet. See Fig. 10 Lean Assessment Summary Form Example. If you have completed a previous assessment, you will have your previous scores as a benchmark when you record the current scores.
| Previous Score | Current Score | |
|---|---|---|
| ||
| 1.5 | 2 |
| 2 | 3 |
|

 TABLE OF CONTENTS