Embedded Generation

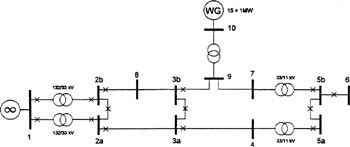
To demonstrate the application of the preceding techniques and to illustrate the types of results that can be obtained, a study extracted from References 36, 37 and 46 is described in this section. The network used is shown in Figure 7.11. It is a 33/11 kV meshed system connected to the 132 kV network by two parallel transformers. The total load is 82.55 MW. The inclusion of a wind farm made up of 15 1 MW machines and connected to bus 9 as shown was considered. Typical wind, wind turbine, load profile and reliability data were used. The reliability indices for the load buses, including interruption and energy indices, are shown in Table 7.12.
| Load point | Load (MW) | ? (f/year) | U (h/year) | r (h) | ENS (MWh) |
|---|---|---|---|---|---|
| 2a | 28.75 | 0.0000 | 0.0019 | 82.550 | 0.034 |
| 2b | 28.75 | 0.0000 | 0.0019 | 82.550 | 0.034 |
| 3a | 7.85 | 0.7585 | 12.726 | 16.802 | 59.98 |
| 3b | 7.85 | 0.8400 | 14.096 | 16.808 | 66.44 |
| 5a | 4.50 | 0.0110 | 0.1181 | 10.784 | 0.319 |
| 5b | 4.50 | 0.0110 | 0.1181 | 10.784 | 0.319 |
| 6 | 0.35 | 0.6160 | 3.1420 | 5.1029 | 0.660 |
The following observations can be made. The load point reliability indices for the split busbars 2 and 5 are the same. However, the indices for the split busbar 3 are different. This is because the lines between busbars 2b and 3b (lines 2a 3a and 2b 3b) and the line between busbars 2a and 3a have different reliability characteristics. The...