Ethernet Passive Optical Networks

Clearly addressing efficiency, performance, and implementation issues, this book provides valuable, annotated insights into all engineering-critical EPON topics.
 TABLE OF CONTENTS
 To obtain an accurate and realistic performance analysis, it is important to simulate the system behavior with appropriate traffic injected into the system. Most of the simulation experiments described in Part 4 of this book were performed with self-similar traffic. To generate self-similar traffic, we used the method described in [TWS97], in which the resulting traffic is an aggregation of multiple substreams, each consisting of alternating Pareto-distributed on/off periods.
Pareto distribution is a heavy-tailed distribution with the probability density function (pdf)
| (B.1) | 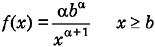 |
where ? is a shape parameter (1 < ? < 2) and b is a location parameter. Pareto distribution with 1 < ? < 2 has a finite mean and an infinite variance.
In our implementation, each substream generates packets of constant size, although this size is different for different streams. To achieve the required packet size distribution (like trimodal distributions reported in [CMT98] or [SG01]), some substreams have higher relative load than the other substreams. Multiplexing (serializing) packets from different substreams produces self-similar traffic with the desired packet size distribution.
Each substream generates packets in groups (packet trains or bursts). The number of packets per burst (on period) follows the Pareto distribution with a minimum of 1 (i.e., the smallest burst consists of only 1 packet) and shape parameter ? = 1.4. The choice of ? was prompted by measurements on actual Ethernet traffic performed by Leland et al. [LT+94], who estimated the Hurst parameter to approximately be equal...