The Global Technology Revolution 2020, In-Depth Analyses: Bio/Nano/Materials/Information Trends, Drivers, Barriers, and Social Implications
Determining Country Capacity to Implement Technology Applications Relevant to Problems and Issues

The previous section examined how drivers and barriers affect a country's capacity to implement TAs, clearly demonstrating that the capacity to acquire a TA does not necessarily imply the capacity to implement it. To analyze a country's capacity to implement TAs, we considered three factors: (1) capacity to acquire, defined as the percentage of the "top 16" TAs listed for that country in Figure 3.1; (2) the percentage of ten drivers for implementation applicable to that country, as listed in Figure 3.1; and (3) the percentage of ten barriers to implementation applicable to that country, also as listed in Figure 3.1. [253]

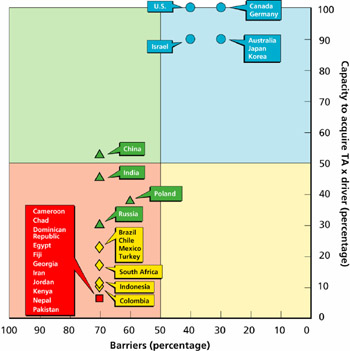
Figure 3.2 shows the position of each of the 29 representative countries on a plot for which the y-axis is the product of factors 1 and 2 that is, the capacity to acquire scaled by the percentage of drivers [254] and the x-axis is factor 3. Both axes are shown as percentages, with the y-axis starting at zero (i.e., there is no capacity to acquire TAs and there are no drivers) and ending at 100 (i.e., the capacity to acquire all 16 TAs and all 10 drivers are applicable), and the x-axis starting at 100 (i.e., all 10 barriers are applicable) and ending at zero (i.e., no barriers are applicable).


Figure 3.2: Selected Countries' Capacity to Implement the Top 16 Technology Applications

In Figure 3.2, countries are represented in the colors and icons that we established...

UNLIMITED FREE
ACCESS
TO THE WORLD'S BEST IDEAS

SUBMIT
Already a GlobalSpec user? Log in.

This is embarrasing...

An error occurred while processing the form. Please try again in a few minutes.

Customize Your GlobalSpec Experience

Category: Spring Washers
Finish!
Privacy Policy

This is embarrasing...

An error occurred while processing the form. Please try again in a few minutes.