Mathematica Demystified

Simple enough for a beginner, but challenging enough for an advanced user, this hands-on guide takes you from your very first calculation all the way to plotting complex fractals in Mathematica.
 TABLE OF CONTENTS
 Mathematica can be used to draw beautiful pictures that make it easy to visualize complicated curves, surfaces, data sets, or other shapes. In this chapter we'll focus on two-dimensional graphics. In Chap. 6 we'll introduce tools to display three-dimensional objects.
One of the most fundamental and useful graphics tools is the Plot function which can be used to draw the graph of a function. Here is a simple example.
In[74]:= ( * using Plot to graph a function *) <b class="bold">Plot [Sin [</b>x<b class="bold">], {</b>x<b class="bold">, 0, 2 Pi}]</b> 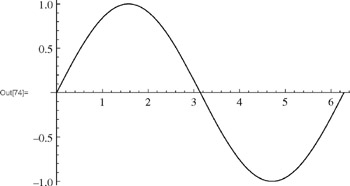
The Plot function takes two arguments. The first is the function that we want to plot which, in this case, is the sine function Sin[x]. The second argument is the list { x, 0, 2 Pi} which tells Mathematica to graph sin x from x = 0 to x = 2 ?. In other words, this list indicates the domain of the function. The domain list { x, 0, 2 Pi} is similar to the counter list { k, 1, 10} that we might include as an argument to the Table function. In both cases we are naming a variable, x or k, and giving the minimum and maximum values that we want it to vary between. With the Plot function it is important that the variable we use in...