Mathematica Demystified

Simple enough for a beginner, but challenging enough for an advanced user, this hands-on guide takes you from your very first calculation all the way to plotting complex fractals in Mathematica.
 TABLE OF CONTENTS
 Sometimes we want to find the limit of a function of several variables. For example, what is
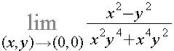
Of course, right away we see that the function is not defined at (0, 0). In fact, it is not defined on either coordinate axis. To try to see what is going on, we have several tools at our disposal: we can use Plot3D to visualize the graph of the function, we can use ContourPlot to also help see what the graph must look like, and we can also use Limit if we restrict ourselves to approaching (0,0) along various curves. Unfortunately, Mathematica does not have any function specifically designed for computing multivariable limits. Let's start with Plot3D and ContourPlot.
<span class="inlinemediaobject"><a NAME="IMG_228"> href="portalcontent.asp?bkid=29884&image_src=https://images.books24x7.com/bookimages/id_29884/figu174%5F1%5F0%2Ejpg&image_id=228&previd=IMG_228"> target="_parent"><img alt="Image from book"> border="0"> height="25"> id="IMG_228"> src="https://images.books24x7.com/bookimages/id_29884/figu174_1.jpg"> title="Click To expand"> width="240"></a></span>
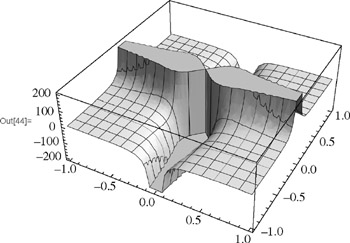
From the plot we can see that something nasty appears to be happening near zero! Away from (0,0), as we approach the x-axis the function appears to be approaching infinity and as we approach the y-axis the function appears to be approaching negative infinity. Example 7.3.2 gives us the contour plot.
From the contour plot it appears that the lines y = x are contours, or level curves. Sure enough, if we let y = x then the function becomes 0/(2 x 6)= 0 for all x ? 0. So, if we were to approach (0,0) along the line y...