10.5 The Normal (Gaussian) Distribution
The normal distribution is the most widely used distribution in scientific and engineering applications, demographic studies, poll results, and business applications.
Suppose we gather and plot the heights (in feet and inches) of several people versus the number of these people. If many samples are collected, we obtain the curve shown in Figure 10.10. This is the so-called bell curve of the normal distribution.
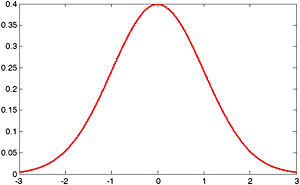 Figure 10.10: The shape of the normal distribution.
 The pdf of the normal distribution is defined as
where = mean and ? x = standard deviation.
If the mean is zero, i.e., if = 0, (10.34) reduces to
The cdf of the normal distribution is
The normal distribution is usually expressed in standardized form, where the standardized rv Z is referred to as the standardized rv X and, in this case, Z is related to X as
Then, the mean of the rv Z is = 0 and the variance is one, that is,  . The pdf of the standardized normal distribution is then simplified to
and the corresponding cdf becomes
where u is a dummy variable of integration.
Figure 10.11 shows the standard normal curve. It also shows the areas within 1, 2 and 3 standard deviations from the mean taken as zero.
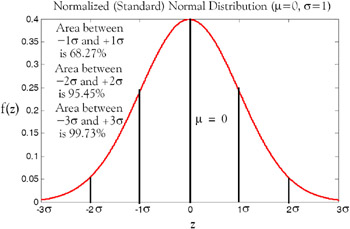 Figure 10.11: The standardized normal curve
 As shown in Figure 10.11, the area for the interval ?1 ? ? z ? + 1