10.8 The Chi-Square Distribution
The ? 2 (chi-square) distribution, like the t-distribution, is a family of probability distributions, and each separate distribution is determined by the degrees of freedom, which we will denote as df.
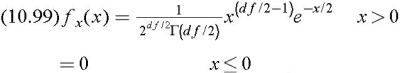
The pdf of the ? 2 distribution is given in terms of the ? (gamma) function which is discussed in Appendix C. For the ? 2 distribution,
Figure 10.19 shows the ? 2 distribution for df = 5, df = 10, and df = 15.
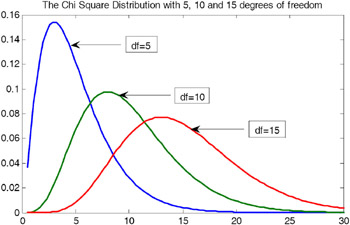 Figure 10.19: The ? 2 distribution for different degrees of freedom.
 The MATLAB script to plot the pdf of the ? 2 distribution is listed below.
x=linspace(0.5,30); chi_sq5=1./(2.<sup^</sup>(5./2).*gamma(5./2)).*x.<sup^</sup>((5./2)<span class="unicode">?</span>1 ).*exp(<span class="unicode">?</span>x./2);chi_sq10=1 ./(2.<sup^</sup>(10./2).*gamma(10./2)).*x.<sup^</sup>((10./2)<span class="unicode">?</span>1).*exp(<span class="unicode">?</span>x./2);chi_sq15=1./(2.<sup^</sup>(15./2).*gamma(15./2)).*x <sup^</sup>((15./2)<span class="unicode">?</span>1).*exp(<span class="unicode">?</span>x./2);plot(x,chi_sq5,x,chi_sq10, ,chi_sq15);title( The Chi Square Distribution with 5, 10 and 15 degrees of freedom )
The mean of the ? 2 distribution is
and the variance is
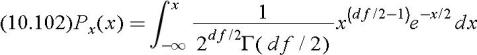
Percentile values of the ? 2 distribution for different degrees of freedom are denoted as  and can be found in math tables such as the CRC Standard Mathematical Tables. The tables give values of x for the cdf
These tables give values for the number of degrees of freedom equal to 1, 2, ..., 30 and for P x (x) from 0.005 up to 0.995.
Example 10.20 Figure 10.20 shows an ? 2 distribution with df = 5.
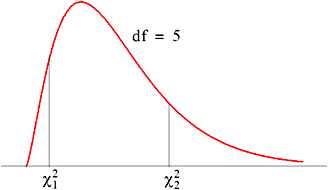 Figure 10.20: ? 2 distribution for Example 10.20
 Find the values of  and
and  for which