10.9 The F Distribution
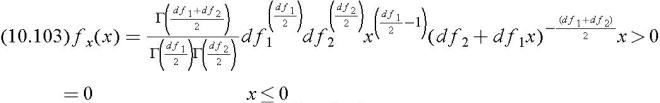
The F distribution is another family of curves whose shape differs according to the degrees of freedom, The pdf of the F distribution is
These curves differ not only according to the size of the samples, but also on how many samples are being comparecd. The F distribution has two sets of degrees of freedom, df 1 (degrees of freedom for the numerator) and df 2 (degrees of freedom for the denominator). The designation of an F distribution with 10 degrees of freedom for the numerator, and 15 degrees of freedom for the denominator is df = (df 1, df 2) = (10, 15).
Figure 10.21 shows two F distributions, one with df(8, 40), and the other with df(8, 4).
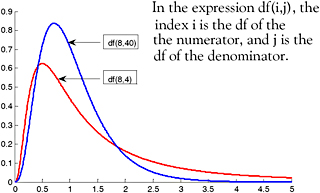 Figure 10.21: The F distribution for different degrees of freedom.
 The mean of the F distribution is given by
Thus, for the F distribution with df(8, 40),
and for the other with df(8, 4),
The variance of the F distribution is given by
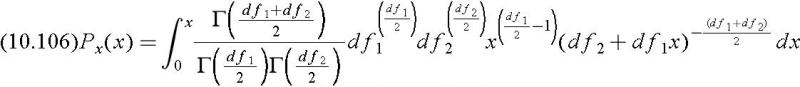
Percentile values of the F distribution for different degrees of freedom are denoted as F p and can be found in math tables such as the CRC Standard Mathematical Tables. The tables give values of x for the cdf
The F distribution tables are based on the df 1 and df 2 degrees of freedom and provide values corresponding to
Lower percentile values for the F distribution can be found from the relation