Naturally Fractured Reservoirs, Second Edition
In some instances, induction logs indicate the presence of fractures. This is possible when there are resistivity anomalies in an interval and sufficient resistivity contrast with adjacent beds (Timko, 1966).
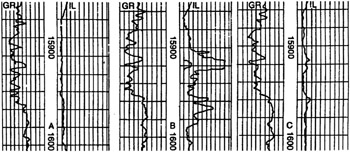
Figure 3 9 presents gamma ray and induction logs for a Gulf Coast well run at three different times. Figure 3 9A shows the gamma ray and induction logs run between 15,850 and 16,020 ft following drilling with 17.1 lb/gal inverted oil emulsion mud. When the well was deepened to 16,294 ft, a pressure kick occurred. As a result the mud density was increased to 17.5 lb/gal. This new density allowed the mud to flow in the formation, losing 275 b of mud. Figure 3 9B shows the logs obtained between 15,850 and 16,020 ft following the mud density transition from 17.1 to 17.5 lb/gal.
Then the mud density decreased to 17.3 lb/gal and the mud flowed back from the formation. Figure 3 9C shows the logs obtained following the reduction in mud weight.
Various interesting features are to be noted from this example. First, there is a general increase in resistivity (R Il) in Figure 3 9B compared with Figure 3 9A especially between 15,910 and 15,925 ft. This can be interpreted by saying that the formation was fractured (or maybe an existing hairline fracture was opened) as a result of increasing the mud density from 17.1 to 17.5 lb/gal. The 275 b of nonconductive inverted oil emulsion mud lost to the...