Naturally Fractured Reservoirs, Second Edition

COMPARISON OF POROSITY ESTIMATES FROM DIFFERENT SOURCES

Pickett and Reynolds (1969) introduced a statistical method for evaluating fractured reservoirs. Initially, it is assumed that the neutron log (or density or the combination neutrondensity) provides total porosity and that core porosity provides matrix porosity.

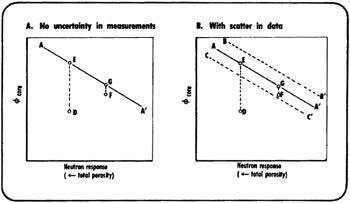
Figure 3 12 (A) shows an idealized schematic of neutron response vs. core porosity, with no uncertainty in measurements, i.e., both log and core measurements have perfect precision. Data points representing unfractured zones would be located in segment AA ?, where total porosity equals the matrix porosity. Points D and F would represent fractured zones, i.e., zones where total porosity is greater than matrix porosity. Measures of fracture porosity would be provided by the distances DE and FG.


Figure 3 12: Neutron response vs. core porosity, idealized case (after Pickett & Reynolds, 1969)

Figure 3 12 (B) shows a diagram of neutron response vs. core porosity for a more realistic case where there is scatter in data. Here, the data points representing the unfractured zones are contained between BB ? and CC ?. Point D represents a fractured zone, and the distance DE is a measure of fracture porosity.

Some fracture zones could fall in the area of scatter for unfractured zones, as in point F. The evaluation from there depends on the presence of a normal distribution about the average correlation of the response when no fractures are present. Experience indicates that unfractured porosity usually has a normal distribution.

UNLIMITED FREE
ACCESS
TO THE WORLD'S BEST IDEAS

SUBMIT
Already a GlobalSpec user? Log in.

This is embarrasing...

An error occurred while processing the form. Please try again in a few minutes.

Customize Your GlobalSpec Experience

Category: Densometers and Porosimeters
Finish!
Privacy Policy

This is embarrasing...

An error occurred while processing the form. Please try again in a few minutes.