19.1 WHEN AND HOW TO APPLY
In testing programs, the experimental results are usually not identical to those obtained from theoretical distributions. Therefore, several theoretical distributions are fitted to the experimental data and the chi-squared goodness-of-fit test is used to determine which distribution fits the data best.
If the normal distribution is to be fitted to the data, then, since the population mean and standard deviation; i.e., the two parameters of the distribution are unknown, their estimates are calculated first.
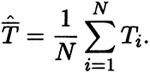
The estimate of the mean,  , is defined as the arithmetic mean value of the data, T i, or
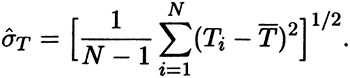
The estimate of the standard deviation,  , is given by
If a histogram is to be developed, the data are grouped first into a suitable number of class intervals, and the observed frequency that falls in each class interval is counted. The optimal number of class intervals, k, may be estimated from Sturges' Rule, or
| (19.1) | 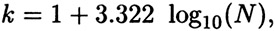
|
where N is the sample size. The class width, w, is given by
where r = T max - T min. w is rounded off to the nearest measurement accuracy figure. The class starting values are determined by beginning with the minimum observed value and adding to it successively the class width, w. The class end values are determined by adding to each class starting value the quantity ( w ?), where ? is the measurement accuracy. The lower bound of...