RSM Simplified: Optimizing Processes using Response Surface Methods for Design of Experiments

Rotatability what's in it for you? Well, first of all recall from Chapter 4 that the standard error plot (Figures 4-9a and 4-9b) for the design we held up as a sterling RSM exhibited perfectly circular contours, which indicates that equally precise predictions will be obtained at any location equally distant from the center point of the experimental space. Any other pattern would indicate that the design favors moving from your bull's eye at the middle in one direction versus another, thus indicating a bias on the part of the experimenter. As you've learned by now, bias is a four-letter word in statistical jargon, one that must be avoided if at all possible.
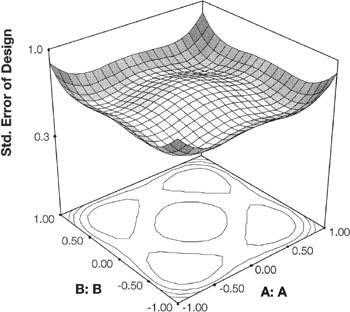
Consider an example of a nonrotatable design a full three-level factorial. The standard error plot for a 3 2 design (9 runs, only one a center point) can be seen in Figure 8-3
First of all, notice that the projected contours are not circular, thus indicating nonrotatability. However, as a more practical matter, see that there are four well-predicted pockets at regions that probably hold no more interest for the experimenter than any other combination of factors.
Box and Hunter (1957) were the first DOE experts to tout rotatability as a desirable feature for response surface methods. To generate this property in a CCD, the value of alpha must conform to the following function:
? =...