Engineering Surveying, Sixth Edition

With many worked examples and illustrations of tools and techniques, this important text gives readers a clear understanding of fundamentals such as vertical control, distance, angles and position.
Figure 10.28 indicates the usual situation of two straights projected forward to intersect at I with a clothoid transition curve commencing from tangent point T 1 and joining the circular arc at t 1. The second equal transition commences at t 2 and joins at t 2. Thus the composite curve from T 1 to T 2 consists of a circular arc with transitions at entry and exit.
Fixing the tangent points T 1 and T 2
In order to fix T 1 and T 2 the tangent lengths T 1 I and T 2 I are measured from I back down the straights, or they are set out direct by coordinates.
| (10.18) | 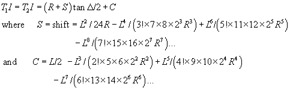 |
The values of S and C are abstracted from the Highway Transition Curve Tables ( Metric) (see Table 10.2).
Setting out the transitions
Referring to Figure 10.29:
The theodolite is set at T 1 and oriented to I with the horizontal circle reading zero. The transition is then pegged out using deflection angles ( ?) and chords (Rankine's method) in exactly the same way as for a simple curve.
The data are calculated as follows:
The length of transition L is calculated (see design factors in Section 10.5.5 and 10.5.6), assume L = 100 m.
It is then split into, say, 10 arcs, each 10 m in length (ignoring through chainage), the equivalent chord lengths being...