Engineering Surveying, Sixth Edition

With many worked examples and illustrations of tools and techniques, this important text gives readers a clear understanding of fundamentals such as vertical control, distance, angles and position.
Figure 10.31 illustrates a transition curve T 1PE. Through P; where the transition radius is r, a simple curve of the same radius is drawn and called the osculating circle.
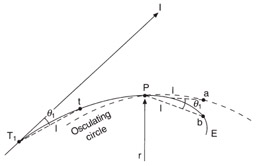
At T 1 the transition has the same radius as the straight T 1I, that is, ?, but diverges from it at a constant rate. Exactly the same condition exists at P with the osculating circle, that is, the transition has the same radius as the osculating circle, r, but diverges from it at a constant rate. Thus if chords T 1 t = Pa = Pb = l, then:
This is the theory of the osculating circle, and its application is described in the following sections.
Figure 10.32 illustrates the situation where the transition has been set out from T 1 to P 3 in the normal way. The sight T 1 P 4 is obstructed and the theodolite must be moved to P3 where the remainder of the transition will be set out. The direction of the tangent P 3 E is first required from the back-angle ( ? 3 - ? 3).
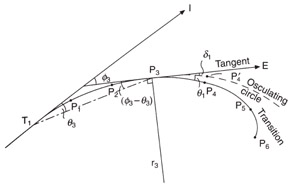
From the figure it can be seen that the angle from the tangent to the chord...