Open VMS Operating System Concepts, Second Edition

A combination of general operating system theory and specific OpenVMS concepts makes this book interesting.
 TABLE OF CONTENTS
 This section describes the paging-related measurement tools available in the OpenVMS operating system. The examples provide a more intuitive feeling for what the memory management subsystem is doing. Figure 4.12 reproduces the output display for the command MONITOR SYSTEM, which is updated every six seconds. Memory management statistics are found in the middle of the display. In the center left-hand box labeled MEMORY, the top half of the box represents the average number of page faults per second. Our example shows that there was an average of 63 page
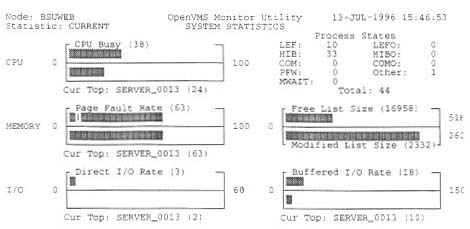
faults per second in the most recent six-second interval that is, 378 faults altogether. It also shows both soft and hard faults, separated by the vertical bar (hard faults are on the left of the bar). No numeric value is displayed to indicate the precise hard and soft breakdown. The lower half of the MEMORY box shows which process produced the most page faults during those six seconds. There is no way to distinguish hard faults from soft faults at the process level. Our example shows that Process SERVER_0013 faulted the most at 63 faults per second. Notice that the process' name, not the image name, is displayed. An unprivileged user cannot find out the name of another user's executing image.
The center right-hand box of the figure shows the sizes of the free and modified frame lists. In this case, there are 16,958 free frames, and maximum free space cache is 51...