11.5.1 COMPLETE, OR NONCENSORED, LIFE DATA
Case 1- Ungrouped, or individual, data set
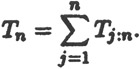
First, a data set without ties is considered. Let 0 ? T 1: n T 2: n < ....< T n:n be an ordered and complete sample from a life test of n components. Then the TTT statistic, at each failure time, T i: n, based on this sample, is given by Eq. (11.2), or
| (11.38) | 
|
The scaled TTT statistic at each failure time is defined by Eq. (11.3), or
| (11.39) | 
|
where
The observed cdf at each failure time is defined as
| (11.40) | 
|
Therefore, plotting ? i versus u i, or equivalently plotting the points
| (11.41) | 
|
and connecting these points with line segments yields the scaled TTT plot for this particular sample which should converge to the scaled TTT transform of the underlying life distribution, ?( u), as n goes to infinity.
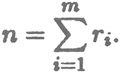
Second, a data set with ties is considered. In this case, n components are life tested until all fail. A total of m < n distinct failure times are observed at W 1 < W 2 < < W m, respectively. Let r i be the number of failures which occurred at W i, i = 1, 2, ..., m. Therefore,
Then, the TTT statistic...


 TABLE OF CONTENTS