Design and Analysis of Gauge R&R Studies: Making Decisions with Confidence Intervals in Random and Mixed ANOVA Models
The first model we consider is the balanced one-factor random design. This model describes a gauge R&R study in which a single operator selects a random sample of p parts and measures each part r times using the same measurement gauge.
Table 2.1 presents a subset of data reported by Houf and Berman [32]. In this example, the monitored parts are power modules for a line of motor starters. The response is the thermal performance of the module measured in C per watt. Measurements are taken on the device using a thermal resistance measuring instrument. The data shown in the table represent measurements taken by a single operator. Each response has been multiplied by 100 for convenience of scale. The p = 10 parts were sampled at random from the manufacturing process, and r = 2 replicate measures were made on each part.
| Part | Measurements ( r = 2) |
|---|---|
| 1 | 37, 38 |
| 2 | 42, 41 |
| 3 | 30, 31 |
| 4 | 42, 43 |
| 5 | 28, 30 |
| 6 | 42, 42 |
| 7 | 25, 26 |
| 8 | 40, 40 |
| 9 | 25, 25 |
| 10 | 35, 34 |
We now present the model used to analyze the data in Table 2.1. The completed analysis is reported in Section 2.5.
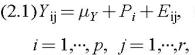
The balanced one-factor random model is
where ? Y