Excel for Scientists & Engineers

For scientists and engineers tired of trying to learn Excel with examples from accounting, this self-paced tutorial is loaded with informative samples from the world of science and engineering.
 TABLE OF CONTENTS
 Measurements are usually based on a sample taken from the total population (see Figure - 13).
This sample can be either:
a test group taken from the total population or
a finite series of measurements done from among an infinite number of potential measurements.
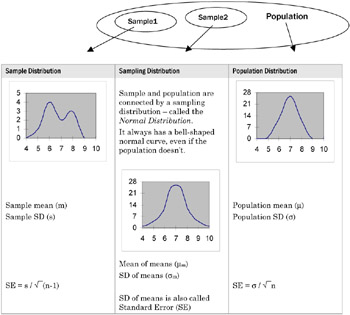
The mean of a sample distribution is the result of observing a specific sample. Other samples could have given us different means. The collection of all possible means is the focus of a sampling distribution.
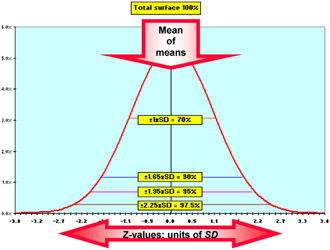
A normal distribution is a sampling distribution with the following properties:
1x the StDev around the mean is 70% of its total surface (= 1 SE)
1.65x StDev is 90% (= 1.65 SE)
The Z-value is plotted on the X-axis of Figure - 14. The Z-value represents the distance between a specific mean and "the Mean of the means," expressed in units of Standard Error (which is the Standard Deviation of the means).
| Description | Function |
|---|---|
| Mean of a range of numbers | =AVERAGE ( range) |
| Standard deviation of a range of numbers | =STDEV( range) |
| Skewness of a range of numbers: skewed far to the left (-1) or to the right (+1) | =SKEW( range) |
| Kurtosis |