Excel for Scientists & Engineers

For scientists and engineers tired of trying to learn Excel with examples from accounting, this self-paced tutorial is loaded with informative samples from the world of science and engineering.
 TABLE OF CONTENTS
 | 1. | Start with a new spreadsheet and use the information from Figure - 12. |
|
| 2. | Calculate the time lapse. |
|
| 3. | Format the cells properly. |
|
| 4. | Calculate glucose mol/min.
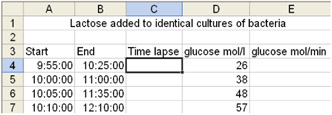 Figure 12: Measuring changes in glucose levels after certain time intervals. |
|
Answers
| 1. | |
| 2. | in C4: =B4-A4 |
| 3. | format: h:mm:ss (if >24 hrs: [h]:mm:ss) |
| 4. | in E4: =D4/(C4*24) |
| 1. | Fill A1:A10 with these values: 24, 27, 20, 23, 25, 25, 24, 22, 26, 29 |
|
| 2. | Find the Mean and StDev. |
|
| 3. | Create these bins: 21, 23, 25, 27, 29 |
|
| 4. | Put the frequency next to each bin. |
|
| 5. | Put the Z-value that comes with that bin value next to each bin. |
|
| 6. | Place the cumulative surface area of each Z-value next to that Z-value. |
|
| 7. | Save your file. |
|
Answers
| 1. | |
| 2. | 24.5; 2.55 |
| 3. | |
| 4. | 1; 2; 4; 2; 1 |
| 5. | -1.4; -0.6; 0.2; 1; 1.8 |
| 6. | 0.09; 0.28; 0.58; 0.84; 0.96 |
| 7. |
| 1. | Create a column with 13 Z-values: -3.0, -2.5, ... 2.5, and 3.0 |
|
| 2. | Create a second column with the corresponding cumulative surface areas by using correct function. |
|
| 3. | Save your file. |
|
Answers
| 1. | |||||||||||||||||||||||||||||
| 2. | |||||||||||||||||||||||||||||
| 3. |
|
| 1. | What are the degrees of freedom in a sample of 25 cases? |
|
| 2. | What is the critical t-value in this sample for a 5% probability? |
|
| 3. |