Material Forming Processes

This text covers techniques such as injection molding, composites forming, die extrusion, hydro-forming, blowing, forging, machining and cutting, super plastic forming, as well as a number of other specific processes.
Results of density measurements on iPP samples prepared in the modified injection molding machine are reported in Figure 1 for different solidification pressure conditions ranging from 0.1 to 40 MPa.
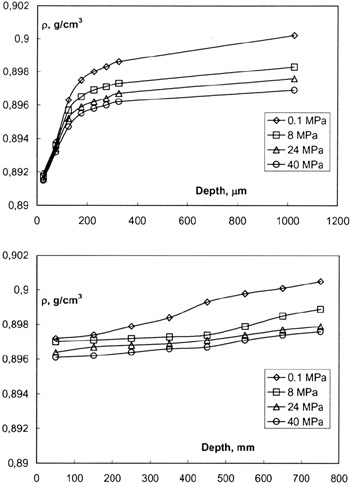
Figure 1a reports the density depth profile for samples characterized by a surface cooling rate (at 70 C) of about 100 C/s, whereas Figure 1b reports the density depth profile for samples characterized by a surface cooling rate (at 70 C) of about 20 C/s. Cooling rates have been evaluated at 70 C since it has been shown that the cooling rate calculated at 70 C is a good measure of quench effectiveness for iPP (Piccarolo, 1992; Piccarolo et al., 1992).
Figure 1 shows that for all pressure values, density increases proceeding from the surface to the bulk of the sample, this behavior can be related to an increase of crystallinity since deeper slices are cooled at lower rates. Furthermore, the largest part of the density increase takes place in the neighborhood of the surface and irrespective of the applied pressure. This was qualitatively confirmed by the polarized light micrographs shown elsewhere (Brucato et al., 2000). If we now consider the effect of pressure, Figure 1 shows that density decreases when pressure increases at the same depth. The decrease in density due to the...