11.6 Percentiles
Percentiles split the data into 100 parts. Let us consider the pdf of Figure 11.15. The area to the left of point x a is a; we denote this area as a percentile p a. Typical percentile values are 0.05 or 5%, 0.10 or 10%, 0.95 or 95%, and 0.99 or 99% and these are denoted as p 0.05, p 0.10, , p 0.95, or p 0.99, respectively.
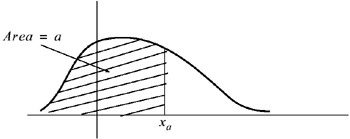 Figure 11.15: Sketch to illustrate the concept of percentile
 For continuous functions, the jth percentile p j is defined as
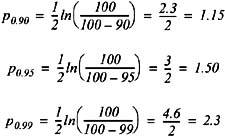
Example 11.15 Compute p 0.90, p 0.95, and p 0.99 for the cdf of the exponential distribution of Figure 11.16 if ? = 1/ 2.
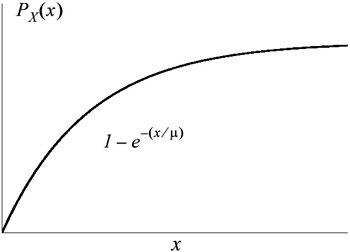 Figure 11.16: Cdf for Example 11.15
 Solution:
From (11.90),
or
Taking the natural log of both sides of the above expression, we get
or
Then,
For a pdf of the discrete type, we can get approximate values of percentiles, if we first arrange the sample in ascending order of magnitude; then, we compute the jth percentile p j, j = 1, 2, 99 from the relation
where n = number of samples.
If i in (11.91) turns out to be an integer, the jth percentile is the average of the observations in positions i and i +