11.8 The Chi-Square Distribution
The ? 2 (chi-square) distribution, like the t-distribution, is a family of probability distributions, and each separate distribution is determined by the degrees of freedom, which we will denote as df.
The pdf of the ? 2 distribution is given in terms of the ? (gamma) function which is discussed in Appendix B. For the ? 2 distribution,
Figure 11.19 shows the ? 2 distribution for df = 5, df = 10, and df = 15.
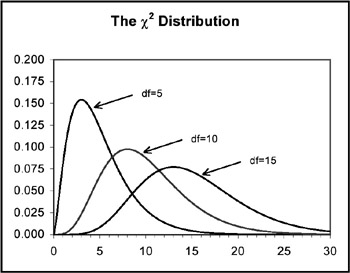 Figure 11.19: The ? 2 distribution for different degrees of freedom.
 The MATLAB code to plot the pdf of the ? 2 distribution is listed below.
<a name="1153"></a><a name="page11_42"></a><span class="serif">x=linspace(0.5,30); chi_sq5=1./(2.^(5./2).*gamma(5./2)).*x.^((5./2)-1).*exp(-x./2);chi_sq10=1./(2.^(10./2).*gamma(10./2)).*x.^((10./2)-1).*exp(-x./2);chi_sq15=1./(2.^(15./2).*gamma(15./2)).*x.^((15./2)-1).*exp(-x./2);plot(x,chi_sq5, '--' ,x,chi_sq10, '-.' ,x,chi_sq15, '-' );lx=[10,15]; ly=[.14,.14]; hold on; plot(lx,ly, '--' ,lx,ly-0.01, '-.' ,lx,ly-0.02, '-' );text(16,0.14, 'df=5'); text(16,0.13, 'df=10'); text(16,0.12, 'df=15');title('The Chi Square Distribution with 5, 10 and 15 degrees of freedom');</span> The mean of the ? 2 distribution is
and the variance is
Percentile values of the ? 2 distribution for different degrees of freedom are denoted as ? 2 p and can be found in math tables such as the CRC Standard Mathematical Tables. The tables give values of x for the cdf
These tables give values for the number of degrees of freedom equal to 1, 2, , 30 and for P X( x) from 0.005 up to 0.995
Example...