This chapter introduces the concepts of curve fitting, regression, covariance, and correlation, as applied to probability and statistics. Several examples are presented to illustrate their use in practical applications.
12.1 Curve Fitting
Curve fitting is the process of finding equations to approximate straight lines and curves that best fit given sets of data. For example, for the data of Figure 12.1, we can use the equation of a straight line, that is,
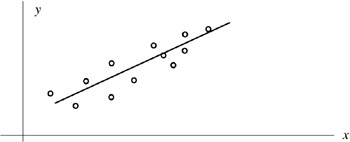 Figure 12.1: Straight line approximation.
 For Figure 12.2, we can use the equation for the quadratic or parabolic curve of the form
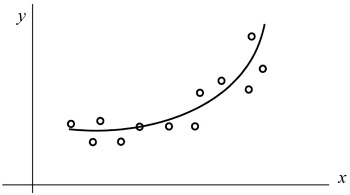 Figure 12.2: Parabolic line approximation
 In finding the best line, we normally assume that the data, shown by the small circles in Figures 12.1 and 12.2, represent the independent variable x, and our task is to find the dependent variable y. This process is called regression.
Regression can be linear (straight line) or curved (quadratic, cubic, etc.) and it is not restricted to engineering applications. Investment corporations use regression analysis to compare a portfolio's past performance versus index figures. Financial analysts in large corporations use regression to forecast future costs, and the Census Bureau use it for population forecasting.
Obviously, we can find more than one straight line or curve to fit a set of given data, but we interested in finding the most suitable.
Let the distance of data point x 1 from the line be denoted as d 1, the distance of data point x 2 from...