Chemical Engineers' Portable Handbook

Emphasizing practice-oriented design and approaches, this guide offers a presentation of the salient and important aspects of chemical engineering for practicing professionals.
Actual physical design of a distillation column is a complicated process. Detailed descriptions of such designs can be found in references 39 42, 45.
Some items of interest will be discussed below.
For example, Figure 5-24 is a typical bubble cap column performance chart.
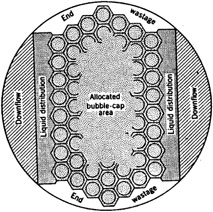
Distribution of areas in a bubble cap column are given in Table 5-7 and Figure 5-25.
| Tower Diam., ft | Downflow area | Liquid-distribution area | End Wastage | |||
|---|---|---|---|---|---|---|
| Crossflow | Double Pass | Crossflow | Double pass | Cascade double | ||
| 3 | 10 20 | 10 25 | 10 30 | |||
| 4 | 10 20 | 8 20 | 7 22 | |||
| 6 | 10 20 | 20 30 | 5 12 | 15 20 | 5 18 | |
| 8 | 10 20 | 18 27 | 4 10 | 12 16 | 4 15 | |
| 10 | 10 20 | 16 24 | 3 8 | 9 13 | 20 30 | 3 12 |
| 12 | 10 20 | 14 21 | 3 6 | 8 11 | 15 25 | 3 10 |
| 15 | 10 20 | 12 18 | 2 5 | 6 9 | 12 20 | 2 8 |
| 20 | 10 15 | 5 7 | 9 15 | 2 6 | ||
| [*]Allocated cap area is determined by difference. |
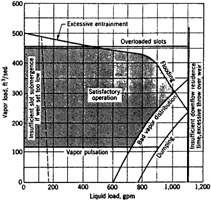
In Figure 5-26 the effect of liquid and vapor loads on sieve tray performance is shown.
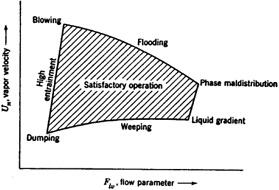
Table 5-8 lists various recommendations for bubble cap columns.
| 1. | TrayTray spacing | |||
| Tower diameter T | Tray spacing t | |||
| M | ft | m | in | |
| 0.15 | 6 minimum | |||
| 1 or less | 4 or less | 0.50 | 20 | |
| 1 3 | 4 10 | 0.60 | 24 | |
| 3 4 | 10 12 | 0.75 | 30 | |
| 4 8 | 12 24 | 0.90 | 36 | |
| 2. | Liquid flow |