Frequency-Domain Characterization of Power Distribution Networks
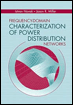
8.7: Bedspring Capacitor Model

8.7 Bedspring Capacitor Model

Figure 8.53 showed the measured impedance and the extracted C( f), ESR( f), and ESL( f) values for a 10- ?F 0508 reverse-geometry MLCC part mounted on a small fixture. In contrast to usual expectations, the minimum of the impedance real part is not at the SRF. At 600 kHz ESR is 2.9 m ?, whereas at the 2.1 MHz SRF, ESR is 3.4 m ?. Moreover, the extracted ESL( f) value is 600 pH at SRF, but the inductance first increases with frequency reaching a 660-pH peak at 4.2 MHz before it starts to drop sharply. Are these unexpected signatures due to measurement errors or a deficiency in the extraction procedure? Do ESR and ESL actually behave contrary to common assumptions?

To examine the frequency dependency of the parameters of an MLCC part, a simplified 2D bedspring model was constructed with 10 horizontal capacitor plates and 10 sections each of capacitor plates and dielectrics. Figure 8.63 shows the partial schematics of the bedspring model. For a physical design with N capacitor plates, each horizontal path of the model represents N/10 plates. The conductive plates are modeled by their series resistances and inductances. To capture the resonances both vertically and horizontally, each model of a capacitor-plate group is further divided horizontally into 10 segments. Each segment is represented by an R p, plate resistance, and L p, plate inductance. The R p resistor...

UNLIMITED FREE
ACCESS
TO THE WORLD'S BEST IDEAS

SUBMIT
Already a GlobalSpec user? Log in.

This is embarrasing...

An error occurred while processing the form. Please try again in a few minutes.

Customize Your GlobalSpec Experience

Category: Inductance Standards and Decades
Finish!
Privacy Policy

This is embarrasing...

An error occurred while processing the form. Please try again in a few minutes.