Introduction to Applied Statistical Signal Analysis: Guide to Biomedical and Electrical Engineering Applications, Third Edition
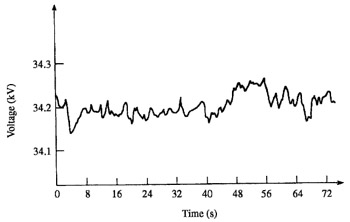
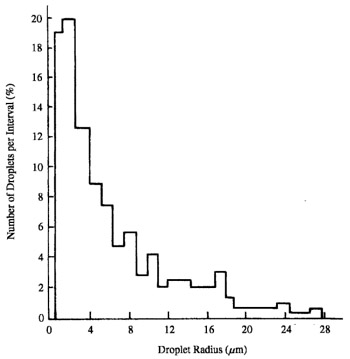
Signals and data that possess random characteristics arise in a broad array of technical, scientific, and economic fields. Consider the record of voltage deviations in a turboalternator that is shown in Figure 4.1. The average value over time seems constant, and there are many undulations. Notice that these undulations do not have a consistent period. The frequency analysis methodologies treated in Chapter 3 would not be applicable for analyzing the frequency content of this signal. Noise in electrical circuits and measurements is another common random signal. In the field of reliability and quality control, one is concerned with characteristics of the output of a production line or a device. Figure 4.2 represents an example showing the size of paint droplets produced by a new design of a spray painting nozzle. In this case the concern is the distribution of droplet sizes and a histogram description is appropriate.
These examples concern continuous random variables, but there are many applications that concern discrete random variables. These are mostly counting processes. For instance, Figure 4.3 shows the daily census over time of the number of patients in a hospital. Other counting processes include numbers of particles produced during radioactive decay, numbers of calls in a telephone switching...